Visualizing Impact with an Organic Waste Diversion Infographic
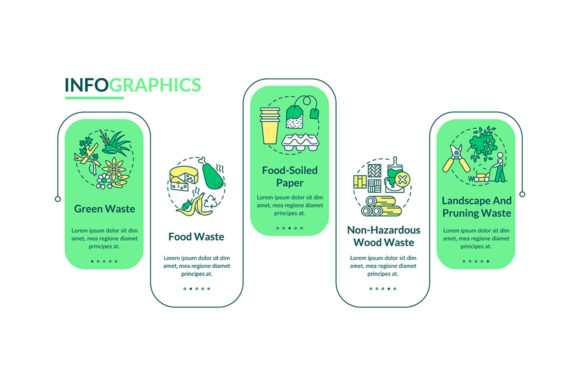
Communicating the complexities of waste management often feels like trying to explain a circular system using only linear text. Sustainability reports, municipal guidelines, and corporate ESG presentations frequently suffer from data density that overwhelms rather than informs. An Organic Waste Diversion Infographic serves as the critical translation layer between technical waste metrics and human understanding. It transforms abstract tonnage and diversion rates into a tangible narrative about resource recovery, environmental stewardship, and operational efficiency. When you utilize a professional vector template for this purpose, you are not merely decorating a slide; you are structuring a conversation about how organic materials move through your specific ecosystem.
Bridging the Gap Between Legislation and Operations
One of the most immediate applications for these visualization tools arises when new organic waste legislation comes into effect. Whether it is California’s SB 1383, New York’s commercial organics recycling laws, or EU circular economy directives, compliance is rarely intuitive. Facility managers and sustainability officers often struggle to convey why these regulations matter to stakeholders who view waste as a cost center rather than a resource stream.
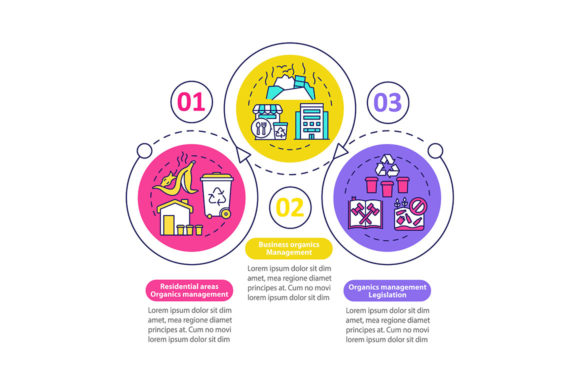
A well-designed infographic addresses this by integrating legislation presentation design elements directly into the workflow visualization. Instead of pasting dense legal text onto a slide, you can map regulatory requirements against your current process timeline. For example, a three-step data visualization can clearly delineate "Current State," "Regulatory Requirement," and "Target Diversion Goal." This approach turns compliance from a punitive mandate into a strategic roadmap. Stakeholders can instantly see where the gaps lie without wading through pages of statutory language. The visual format allows teams to identify bottlenecks in separation or collection before they become compliance violations.
Operational Workflows for Diverse Industries
The utility of an organic waste diversion vector template extends far beyond regulatory compliance. Different industries face unique challenges in managing organic streams, and the flexibility of vector graphics allows for tailored storytelling.
Hospitality and Food Service
In hotels and restaurants, food waste diversion is often a battle against high staff turnover and fast-paced environments. Training materials need to be instant and universally understood. A workflow layout with linear icons can serve as effective back-of-house signage or digital training content. By visualizing the separation process—scraping plates, separating liquids, sorting compostables versus recyclables—you reduce contamination rates at the source. The linear icon style is particularly effective here because it mimics the physical motion of the work, creating a cognitive link between the image and the action required by kitchen staff.
Municipal and Community Programs
For city planners and waste haulers, the audience shifts to residents who may be skeptical or confused about curbside organics programs. Here, the infographic functions as a public education tool. A process timeline chart showing what happens to an apple core after it leaves the curb helps build trust in the system. When residents understand that their separated waste becomes soil amendment for local parks rather than landfill methane, participation rates typically increase. The ability to edit SVG or AI files means municipalities can update these visuals seasonally or as processing facilities change, keeping the community informed without redesigning from scratch.
Corporate Sustainability Reporting
ESG (Environmental, Social, and Governance) reporting requires precision and clarity. Investors and auditors look for verified data, but employees and customers look for authentic commitment. An Organic Waste Diversion Infographic strikes this balance by presenting hard data within an engaging narrative framework. You might use the three-step visualization to highlight year-over-year improvements: Step 1 showing baseline waste generation, Step 2 illustrating implemented reduction strategies, and Step 3 displaying achieved diversion percentages. This structure satisfies the analytical needs of auditors while remaining accessible enough for annual reports and internal newsletters.
Leveraging Data Visualization for Behavioral Change
Data alone rarely changes behavior; context does. The most effective organic management visuals do not just display numbers—they show relationships. When selecting or customizing a template, consider how the data visualization components interact with the process flow. Are the diversion rates positioned next to the relevant stage of the workflow? Does the color coding intuitively signal success or areas needing improvement?
Vector templates offer distinct advantages in this regard because they separate content from form. You can adjust the scale of charts, swap out icons to match your specific equipment (e.g., aerobic digesters vs. windrow composting), and align colors with your brand identity without losing resolution. This adaptability is crucial when presenting to mixed audiences. The same core dataset can be visualized as a high-level executive summary for the C-suite and a detailed operational guide for facility staff, simply by toggling layers or adjusting the complexity of the linear icons.
Practical Considerations Before Implementation
While having access to EPS, JPG, PNG, SVG, and AI files provides immense flexibility, successful implementation requires forethought. Before opening Illustrator or PowerPoint, audit your actual waste data and process documentation. A beautiful infographic built on outdated or inaccurate assumptions can damage credibility faster than no graphic at all.
Consider the end-use environment. If the graphic will be printed as large-format signage for a waste sorting station, you will need the EPS or AI files to ensure crisp edges at scale. If it is destined for a web-based sustainability dashboard, optimized SVG or PNG formats will ensure fast loading times and responsiveness. For legislative presentations that may be shared across government agencies, PDF exports from the vector source maintain formatting integrity regardless of the viewer's software.
Also, evaluate the cultural and linguistic context of your audience. Linear icons are generally universal, but specific symbols for composting or recycling can vary regionally. Customizing the vector elements to match local signage standards prevents confusion. Similarly, ensure that the color palette meets accessibility standards for colorblind users, especially when using color to differentiate between waste streams or performance metrics.
Strengths and Limitations of Template-Based Design
Using a pre-built Organic Waste Diversion Infographic template accelerates communication significantly. The primary strength is structural validity; professional templates are designed with information hierarchy and visual balance already baked in. You avoid common amateur mistakes like cluttered layouts or inconsistent iconography. The inclusion of multiple file formats ensures future-proofing, allowing you to repurpose the asset across print, digital, and video mediums.
However, templates have inherent limitations. They represent generalized best practices, not your specific reality. There is always a risk of forcing your unique process into a predetermined visual mold. If your organic diversion involves four distinct steps but the template emphasizes three, resist the urge to oversimplify. Use the vector editing capabilities to add necessary stages or modify the workflow layout. The goal is accuracy over aesthetic convenience.
Additionally, be wary of generic stock imagery within templates. Authenticity matters in sustainability communication. Replace placeholder photos with actual images of your facility, your team, and your processed materials. This small customization signals that the infographic represents real operations rather than aspirational marketing. When used thoughtfully, these design resources transform complex organic management concepts into clear, actionable intelligence that drives both compliance and cultural change.